Geographic Information System (GIS)
A Geographic Information System (GIS) is a powerful system designed to capture, store, manipulate, analyze, manage, and present all types of geographical data. Think of it as a digital map that's also a database, capable of revealing much more than just location.
GIS is used across various fields, including urban planning, environmental management, transportation, agriculture, and public health, due to its powerful ability to handle large amounts of geographically referenced data and support decision-making.
Key Components of a GIS
Hardware
GIS hardware includes computers, servers, storage devices, and sometimes specialized equipment like GPS units, scanners, and plotters. This hardware forms the backbone of GIS operations, enabling data collection, storage, processing, and display.
Software
GIS software provides tools to perform spatial analysis, data management, and visualization. Popular GIS software includes ArcGIS, QGIS, and MapInfo. These platforms allow users to input, manage, manipulate, and output geospatial data and produce maps, reports, and other spatial data analyses.
Data
GIS data is foundational and can be divided into two main types:
Spatial Data: Describes the physical location and shape of objects on Earth (e.g., roads, rivers, buildings). It’s often represented as points, lines, or polygons.- Vector Data: Represents discrete features using points (e.g., city locations), lines (e.g., roads), and polygons (e.g., land parcels).
- Raster Data: Represents continuous data, often derived from remote sensing, and is made up of pixels or cells (e.g., satellite imagery, elevation models).
Attribute Data: Provides descriptive information about spatial features (e.g., population of a city, pollution levels of a river).
People
GIS technology requires trained professionals who can manage, analyze, and interpret spatial data. These professionals might include GIS analysts, cartographers, data scientists, and domain experts who use GIS for specific applications like environmental management or public health.
Methods and Procedures
These are standardized protocols for data collection, analysis, and interpretation within GIS. Methods include spatial analysis techniques, data quality control measures, and standards for mapping and data sharing.
How GIS Works
Data Collection and Input
GIS starts by gathering data from various sources like satellite images, surveys, sensors, and databases. Data can be input manually or automatically and may come from public records, field observations, or remote sensing technologies.
Data Storage and Management
After collection, data is stored in databases that allow easy retrieval and management. GIS databases often use geodatabases or spatial databases specifically designed to handle large amounts of spatial data, enabling efficient access and management of spatial and attribute data.
Data Processing and Analysis
GIS provides a range of analytical tools to explore relationships, patterns, and trends within the data. Common types of spatial analysis include:
- Overlay Analysis: Combining multiple layers (e.g., land use and topography) to find areas with overlapping characteristics.
- Buffer Analysis: Creating zones around features, such as a 100-meter buffer around a river, to study impact areas.
- Proximity Analysis: Determining the distance between features (e.g., finding the nearest hospital to a school).
- Spatial Interpolation: Estimating unknown values based on known data points (e.g., predicting rainfall levels based on weather station data).
- Network Analysis: Examining movement and accessibility within a network (e.g., shortest path for emergency response).
Data Visualization
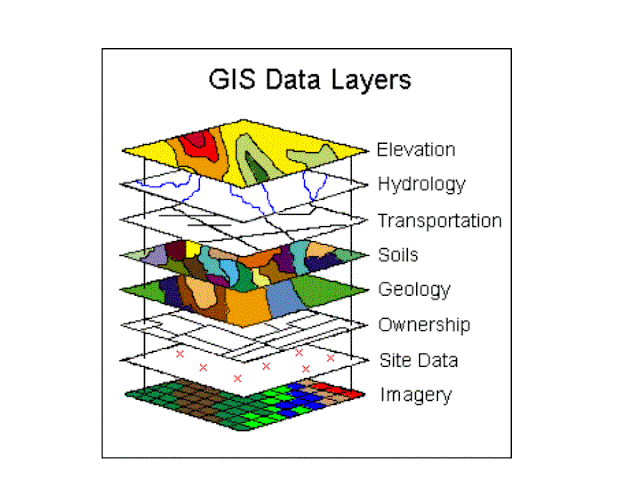
Visualization in GIS typically takes the form of maps, but it can also include charts, graphs, and 3D models. GIS maps are composed of layers, each representing different data types (e.g., vegetation, roads, elevation). Layers can be overlaid to create composite maps that show complex spatial relationships.
Data Output and Reporting
GIS can produce various outputs, such as maps, reports, and digital files, which can be used for decision-making and communication. These outputs can be shared digitally or in print, making it easier for users to interpret and use geographic data effectively.
What GIS Does
Mapping: GIS creates visual representations of geographic data, allowing users to understand spatial relationships and patterns.
Spatial Analysis: This involves performing operations on geographic data to answer questions, solve problems, and make decisions. Examples include overlay analysis, proximity analysis, and network analysis.
Data Management: GIS manages large volumes of geospatial data, ensuring data integrity and accessibility.
Modeling and Prediction: GIS can be used to model real-world phenomena and predict future outcomes, such as the spread of diseases or the impact of natural disasters.
Visualization and Communication: GIS provides tools for creating compelling maps, charts, and other visualizations to effectively communicate geographic information.
Applications & Uses of GIS
GIS is widely applied in many industries due to its versatility and powerful analytical capabilities. Some examples include:
Urban Planning: GIS aids in land use planning, zoning, infrastructure development, and resource allocation.
Environmental Management: GIS helps monitor and manage natural resources, assess environmental impacts, and support conservation efforts.
Agriculture: GIS is used for precision agriculture, soil analysis, crop yield prediction, and irrigation management.
Public Health: GIS helps track disease outbreaks, plan healthcare services, and analyze health-related data.
Transportation: GIS assists in traffic management, route planning, and infrastructure maintenance.
Archaeology: Mapping archaeological sites, analyzing artifact distributions, and reconstructing past landscapes.
Disaster Management: GIS supports emergency response, risk assessment, and disaster preparedness by mapping hazard-prone areas and planning evacuation routes.
Advantages of GIS
Data Integration: GIS integrates diverse datasets into a single system, facilitating comprehensive spatial analysis.
Improved Decision-Making: GIS enables data-driven decision-making, providing insights that guide planning and resource allocation.
Enhanced Visualization: With GIS, complex spatial data can be visualized in an understandable format, like maps and 3D models.
Efficient Resource Management: GIS allows for efficient monitoring and management of resources, which is crucial for sustainability.
Predictive Analysis: GIS supports predictive modeling, allowing for scenario analysis and forecasting, which can help plan for future changes.
GIS is a powerful tool that continues to evolve with advancements in technology. It transforms spatial data into meaningful insights, offering organizations the ability to solve complex geographic problems and make informed decisions.


%20(1).webp)