Paleocurrent Analysis
Paleocurrent analysis is a fascinating technique used by geologists to reconstruct the direction of ancient water currents that deposited sedimentary rocks. By studying these rocks, geologists can unlock clues about past environments, like rivers, beaches, or even deep-sea currents.
A palaeocurrent indicator is evidence for the direction of flow at the time the sediment was deposited, and may also be referred to as the palaeoflow. Palaeoflow data are used in conjunction with facies analysis and provenance studies to make palaeogeographic reconstructions. The data are routinely collected when making a sedimentary log, but additional palaeocurrent data may also be collected from localities that have not been logged in order to increase the size of the data set.
The preceding analysis of sedimentary structures shows that they can be used to determine depositional processes. Because depositional processes occur in several environments, few structures are immediately diagnostic of a specific environment; assemblages of structures are most useful, as for example in a tempestite, a turbidite, or a point bar.
Collection of Paleocurrent Data
Common Paleocurrent Indicators:
Ripple Marks: These wavy features on a rock surface mimic sand ripples on a beach and indicate the direction of current flow.
Cross-bedding: These inclined layers within a rock record the movement of current ripples over time, with the foresets (steeper slopes) pointing in the downstream direction.
Imbricated Pebbles: Flattened pebbles in a rock can be stacked with their long axes pointing in the direction of current flow.
A wide range of sedimentary structures can be used in paleocurrent analysis. Some structures yield only the sense of current flow, others yield both sense and direction. Examples of the first group include groove marks, channels, washouts and parting lineation. Examples of the second group include pebble imbrication cross-lamination, cross-bedding, slump folds, flute marks, and the asymmetric profiles of ripples.
The measurement of the orientation of sedimentary structures must be done with care. Ideally some kind of areal sampling grid should be used for regional paleocurrent mapping. In practice, this ideal approach is commonly restricted by limitations of access, exposure and time.
 |
| Various characteristic azimuthal patterns of paleocurrent data. |
Each sample station will generally consist of a cliff, quarry, stream section, road cut, etc. If it is to be worth anything, paleocurrent analysis must be integrated with a full sedimentological study. Thus each sample station will also be the location of a measured section, or at least some detailed notes on stratigraphy, lithology, facies, and fauna. At each station it is necessary to record structural dip and strike. If it is excessive (greater than about 10~ each measurement must be corrected on a stereographic net.
The orientation of the structures will be recorded, including both the azimuth and dip of planar structures that need correction. For linear structures and for planar structures in outcrops of low tectonic dip only the azimuth need be recorded. At the same time, it is necessary to note the type and scale of the structure and the lithology in which it occurs.
Foreset dip directions from cross-bedding should always be measured in plan view. Dip directions seen in vertical sections should only be recorded as a last resort. There are two reasons for this. First, as pointed out earlier in this chapter, cross-beds do not always dip directly downcurrent.
In troughs and laterally infilled channels, foresets are deposited obliquely or perpendicular to current flow. Examination of cross-bedding in plan view gives a clue to the structural arrangement of the foresets. If cross-bedding is measured from vertical facies generally only an apparent dip can be recorded. This may diverge considerably from the true dip direction, especially if there is well-developed jointing. The discrepancy will not be too erroneous, however, as foresets appear horizontal
Presentation of Paleocurrent Data
 A rose diagram is used to graphically summarise directional data such as palaeocurrent information: the example on the right shows data indicating a flow to the south west. |
Paleocurrent data may be entered in a field notebook and subsequently published in tabular form. The azimuths are, however, generally manipulated in some way to make their interpretation easier. The first step involves the removal of tectonic dip on a stereographic net where applicable. Then the azimuths are divided into class intervals from 0 to 360 ~ Class intervals of between 30 and 45 ~ are about typical. The data may then be presented on a histogram. More usually, however, a compass rose is used.
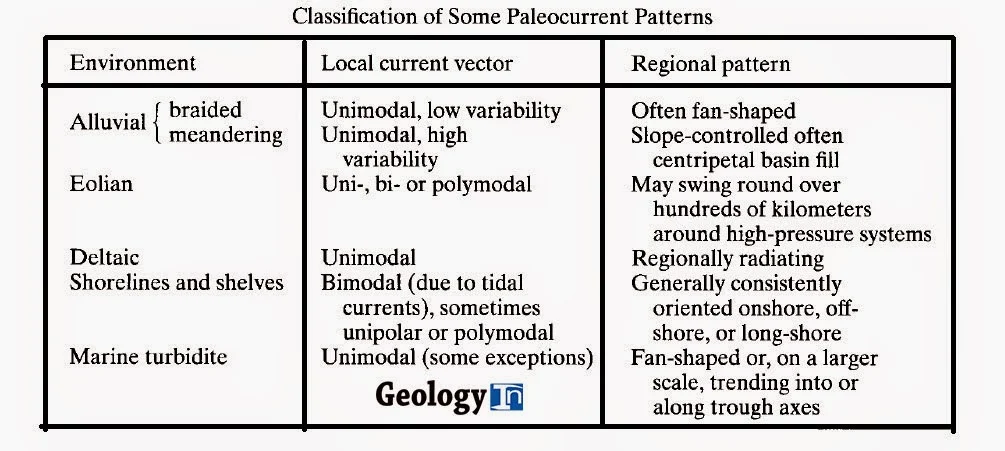
This is a histogram converted to a circular distribution. It is conventional to indicate the direction of dip of foresets. This is contrary to the convention for wind roses, which indicate the direction from which the wind blew. The dominant dip directions, termed modes, are at once apparent from a compass rose. Several types of azimuthal pattern are recognizable in paleocurrent data. A vector mean may then be statistically determined for unimodal data. This may be done mathematically or graphically.


%20(1).webp)


